TL;DR
One million seconds is about 11.6 days. One billion seconds is about 31.7 years. On the page, the difference is three zeroes; in lived time, it is the distance between next week and a large part of a lifetime. This is not evidence that humans are simply bad at mathematics. Numerical judgment breaks in several distinct ways: large magnitudes lose texture, exponential change gets linearized, and conditional probabilities conceal their denominator. Each problem improves when the representation changes. Translate totals into time or per-person units, show compounding as doubling steps, and express risk as natural frequencies from one common group. Numerical literacy is less about staring harder at digits than choosing a form in which the comparison can be seen.
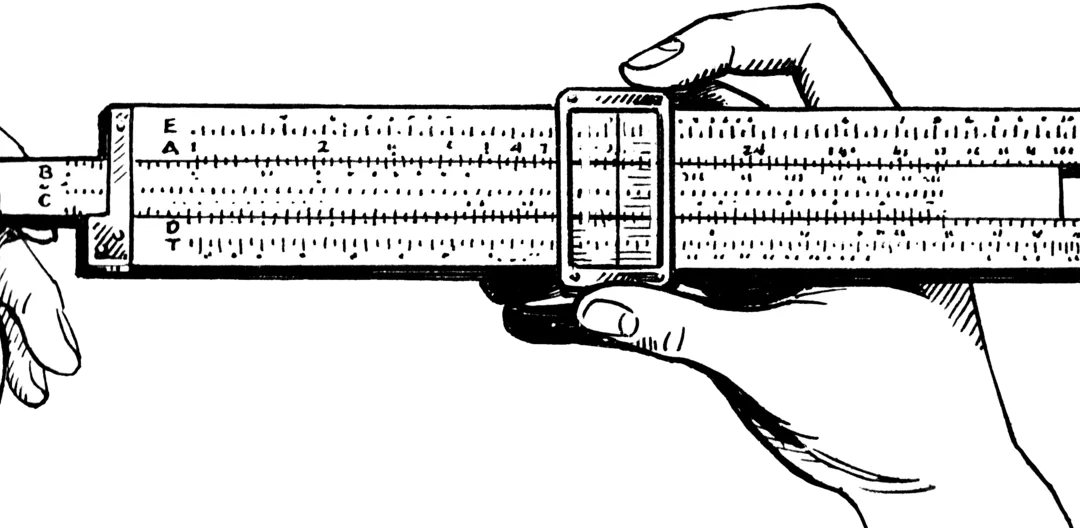
A slide rule performs multiplication by adding distances on logarithmic scales. Good numerical communication does something similar: it changes the representation so a difficult relationship becomes visible. Illustration: Pearson Scott Foresman, public domain.1
Three Zeroes That Contain Thirty-One Years
Do the arithmetic slowly.
There are 86,400 seconds in a day. One million seconds is 11 days, 13 hours, 46 minutes, and 40 seconds.
One billion seconds is one thousand million seconds: about 11,574 days, or 31.7 years.
Most people know that a billion is a thousand million. The sentence rarely produces the same understanding as the time comparison. “Million” and “billion” belong to the same verbal category—very large numbers—and differ by one letter and three zeroes. Eleven days and thirty-two years occupy different regions of experience.
The translation does not add information. It makes existing information cognitively available.
That is the central problem with public numbers. Budgets, wealth, epidemic growth, interest, medical risk, and climate timescales are often presented in technically correct forms that defeat comparison. We then diagnose the audience as innumerate.
Sometimes the audience is. Often the representation is doing unnecessary violence to the reasoning task.
Large Magnitudes Lose Their Texture
Human numerical cognition is not one mechanism. We have an approximate sense of quantity, learned symbolic mathematics, verbal categories, and external tools. These systems behave differently.
Young children often place symbolic numbers on a bounded line in a compressed, roughly logarithmic pattern: small values receive more space and large values bunch together. With education and familiarity, adults usually become much more linear for familiar symbolic ranges.2 That qualification matters. It would be false to say every adult literally stores all numbers on a logarithmic mental ruler.
Yet large unfamiliar magnitudes still bunch together in ordinary judgment. A ₹1,000 crore project and a ₹10,000 crore project can both register as “government-scale money.” Ten thousand and one million casualties can both become “an unimaginable number.” Once quantities leave daily experience, language supplies categories where intuition no longer supplies distance.
The remedy is not always to make numbers smaller. It is to supply a shared unit.
- Time: a million versus a billion seconds.
- Per person: a national programme’s total divided by the population served.
- Per year or day: a lifetime total converted into a rate.
- Physical extent: hectares converted into a familiar city or route.
- Share of a relevant denominator: spending as a fraction of the budget, not as an isolated crore figure.
Each translation can also mislead. Per-capita averages hide distribution; analogies smuggle in emotional associations; percentages hide the size of the base. The discipline is to show both the original number and the translation.
Compounding Looks Linear Until It Doesn’t
The second problem is not magnitude but shape.
Suppose something grows 10 percent each year. Intuition wants to add ten each time: 100, 110, 120, 130. Compounding multiplies: 100, 110, 121, 133.1. The difference looks small early and dominates later.
Economists call the tendency to linearize exponential functions exponential growth bias. In household-finance data, more-biased households borrowed more, saved less, preferred shorter loan maturities, and used and benefited more from financial advice, even after the authors controlled for a wide range of household characteristics.3
The result is not that one cognitive error explains everyone’s finances. It shows why annual rates are a poor intuitive interface. A borrower can compare monthly payments while missing the multiplication embedded in time. A saver can recognize a respectable interest rate while underestimating what repeated compounding does over decades.
The same problem appeared during COVID-19. Across three studies, researchers found that participants tended to perceive early viral spread in largely linear terms. A brief intervention that made the growth process explicit reduced the error and increased support for social distancing in the study setting.4
Real epidemics do not grow exponentially forever; behaviour changes, immunity accumulates, and susceptible populations are finite. The lesson is representational, not predictive. When a process compounds, show intermediate steps, doubling time, and the assumptions under which the curve will bend.
“Seven percent annually” is a rate. “Roughly doubles in ten years if sustained” is a model the mind can inspect.
Probabilities Hide Their Denominators
The third problem appears even when every number is small.
Imagine a disease affecting 1 percent of a population. A test detects 90 percent of cases and falsely flags 9 percent of healthy people. If someone tests positive, what is the chance they have the disease?
The percentages invite algebra and a common wrong answer: 90 percent. Now translate them into 1,000 people.
- About 10 have the disease; 9 of them test positive.
- About 990 do not; roughly 89 of them test positive anyway.
- So about 98 people test positive, of whom 9 have the disease.
The answer is about 9 percent, not 90 percent.
This format is called natural frequencies. In one set of studies with advanced medical students, correct Bayesian inferences averaged 7 percent when information was expressed as probabilities and 45 percent when equivalent information was expressed as natural frequencies—an average improvement of 37 percentage points across the tasks.5
Nothing about the underlying evidence changed. The frequency version keeps the relevant subsets visible and gives every number a common reference class.
This is a profound correction to the lazy claim that people cannot reason about risk. Many can reason much better when we stop forcing them to coordinate several conditional percentages in working memory.
A Small Translation Manual
Different numerical problems require different translations.
For scale
Keep the original total, then add per-person, per-year, or familiar-unit equivalents. When comparing programmes, keep the denominator consistent.
For growth
Show several steps, not only the starting rate and final projection. Add doubling time. State what must remain constant for the projection to hold.
For risk
Use the same reference class: “Out of 1,000 people like you…” Separate how many have the condition, how many test positive, and how many positives are true positives.
For relative effects
Pair relative and absolute change. “Risk fell 50 percent” can mean 2 in 100 became 1 in 100, or 2 in a million became 1 in a million.
For public money
Show the total, share of the relevant budget, duration, and cost per intended beneficiary. None is sufficient alone.
These are not decorative analogies to be added after the analysis. They are part of the analysis because they expose whether two quantities are actually comparable.
The Ethical Question Is Which Form You Choose
Every representation foregrounds something.
A government that announces only a vast programme total invites awe while hiding per-person adequacy. A campaign that reports only a huge cumulative death count may hide the changing rate. A drug advertisement that reports relative risk reduction without baseline risk makes a modest effect look dramatic. A lender that emphasizes monthly payment while burying total repayment exploits time compression.
The answer is not one mandatory format. It is paired representation: total and denominator, rate and steps, relative and absolute, symbol and lived unit.
Numbers do not speak for themselves. They arrive through a choice of scale, frame, denominator, and interval. A technically accurate choice can still be designed to prevent understanding.
Where I’d Hold This Loosely
The million-second comparison is memorable because time is familiar, not because time is the natural unit for every problem. Converting a public budget into seconds would be theatre, not clarification.
Natural frequencies also do not solve disagreements about base rates, test quality, or which population is relevant. They make assumptions visible; they do not validate them.
And biases are not destinies. Mathematicians, accountants, clinicians, and ordinary people using good tools routinely reason about enormous quantities and compound processes. External representation is one of the things human intelligence does, not a crutch that proves its weakness.
The useful conclusion is therefore kinder and more demanding than “people are bad at numbers.” People reason through forms. If a number matters, present it in at least one form in which its size, growth, or denominator can be seen.