Editorial illustration generated for Thenkai: commuters heading to work in urban India.
TL;DR
India’s development expanded what people could do: live longer, study further, enter new kinds of work and escape severe deprivation. The difficulty lies in turning those gains into a dependable livelihood. Regular formal work expanded in the southern states examined, yet about 90% of Indian employment remained informal in 2022. Average real monthly earnings fell 9.7% for regular salaried workers between 2012 and 2022, while rising 27.3% for casual workers.1 My reading is that the opportunities widened unevenly at each stage: preparation, entry into suitable work, earnings and protection, then resources for the future. Education can improve prospects while suitable jobs remain scarce. Lower real earnings can squeeze saving; accessible family resources can soften setbacks. These implications help explain why progress and insecurity coexist. Asian peers and richer countries show different transitions, distributional pressures and possibilities for improvement. The question is how widely growth enables people to build a life they can sustain.
The promise needs a date and a place
Study, find a decent job, save, buy a home, grow old without depending on somebody else’s generosity. There is nothing extravagant about wanting that life.
The strongest version of the complaint is that the effort required to reach it has grown. It allows for better technology, longer lives and a richer country. Its concern is that participating successfully in the economy can still leave someone unable to afford lasting security.
That deserves a more serious response than pointing to GDP. It also deserves a better historical comparison than a remembered family success story.
The question I started with was whether the economy had become progressively harder for ordinary people since the 1950s. Once I put India at the centre, I had to ask who the earlier ordinary person was. A regular employee? A casual labourer? A woman working without wages in a family enterprise? Their starting positions cannot be treated as interchangeable.
The useful question became more specific: how did the opportunities available through work change, and how reliably did those opportunities provide a secure living?
More people reached formal work. Entry remained difficult.
South India brings the distinction into focus.
In the ILO/IHD report’s state appendix, regular formal employment among workers aged 15 and above expanded between 2005 and 2022. Its share rose from about 9.6% to 17.8% in Kerala, 9.3% to 17.0% in Tamil Nadu, and 7.4% to 15.4% in Karnataka.1
These are substantial expansions from low bases. Access to work with formal protections widened, opening a route to greater predictability for a larger share of workers. Even in 2022, however, this remained a minority position.
Among secondary-or-higher-educated labour-force participants aged 15–29, unemployment in 2022 was about 39.0% in Kerala, 26.9% in Tamil Nadu and 17.2% in Karnataka. Compared with 2005, Kerala’s rate fell; the Tamil Nadu and Karnataka rates rose.1 These state figures use principal activity status; the report’s national headline tables also count subsidiary activity. The comparisons here keep those definitions separate.
The coexistence suggests a bottleneck: access to formal work can improve without becoming broad enough to accommodate those seeking suitable jobs. That is an interpretation worth pursuing, rather than proof that qualifications expanded faster than vacancies. Job-search preferences, skills mismatch and the ability to wait could also contribute.
The report supplies an important clue: among employed youths, education is associated with better jobs, even while educated-youth unemployment is higher.1 Education can therefore improve the opportunities a person can pursue while entry into those opportunities remains difficult. Expanding education and expanding suitable work are complementary tasks.
The country got richer. The earnings story split.
The longer history shows how much the starting conditions changed. Within the Maddison Project’s 2020 estimates, India’s GDP per person rose about 6.9 times between 1950 and 2018, measured in comparable purchasing-power-adjusted dollars. This is average production, not the typical worker’s pay.2
Historical estimates compiled by Our World in Data put life expectancy at birth at about 34.8 years in 1950 and 68.6 in 2016. The archived Barro–Lee series puts average schooling among people aged 15 and above at about 1.0 year in 1950 and 6.2 in 2010.34 These are different historical series and endpoints, with modelling and source revisions, rather than a current household survey.
Longer lives and more education are changes in people’s capacity to plan, learn and pursue different work. My inference is that development enlarged the range of lives people could reasonably seek, even though access remained unequal. That is why judging progress only by today’s salaried worker misses a large part of the transformation.
The World Bank’s October 2026 snapshot reports extreme poverty falling from 27.1% in 2011 to 2.6% in 2023 at the $3-a-day threshold in 2021 purchasing-power terms. Survey changes and harmonization affect the magnitude.5 Reduced severe deprivation is an achievement in its own right. The next question is how far households can move beyond that threshold toward resilience and saving.
Then look at earnings.
The ILO/IHD’s inflation-adjusted monthly averages give us a contrast that a single growth rate cannot capture:
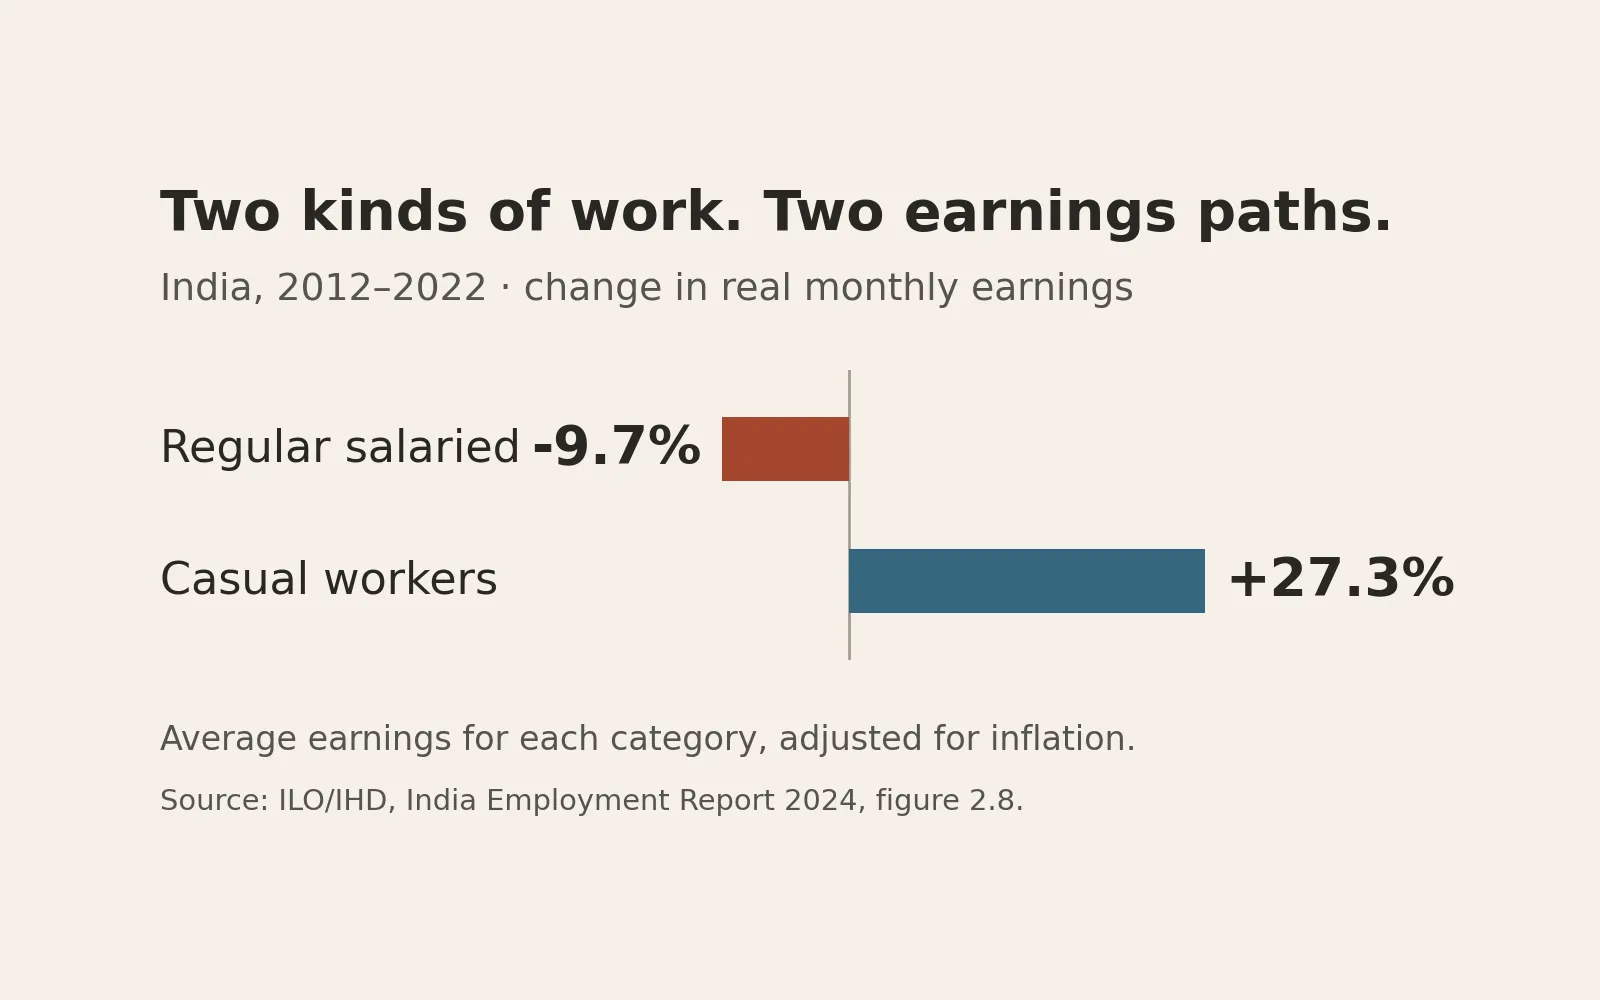
Different changes, very different starting incomes. Chart by Thenkai from the ILO/IHD’s India Employment Report 2024, figure 2.8. These are inflation-adjusted category averages, not the same workers followed over time.1
| Worker category | 2012 | 2022 | Change |
|---|---|---|---|
| Regular salaried | ₹12,100 | ₹10,925 | −9.7% |
| Casual | ₹3,701 | ₹4,712 | +27.3% |
All amounts are at 2012 prices. The report uses rural and urban consumer-price indices to adjust for inflation.1
The casual-worker increase represents improved average purchasing power from a very low base. It could ease immediate consumption pressures for households sharing that improvement, although the later average remained far below the salaried figure.
For a household experiencing the salaried earnings path, the implication runs in the other direction. If real spending and other household income stay unchanged, lower real earnings leave less room to save. Protecting current consumption would then require a smaller surplus, extra income or drawing on existing resources. This is household arithmetic, not a measured saving-rate decline among everyone in the category.
The surveys follow changing groups rather than the same workers. New entrants, occupations and work duration can shift the averages. What survives that qualification is the contrast itself: growth coexisted with different earnings paths, so the route from national prosperity to household resources needs examining directly.
Work becomes security through pay and protection
The ILO/IHD estimates informal employment at 91.5% in 2000, 89.5% in 2019 and 90.3% in 2022.1 The persistence is striking: the economy changed substantially while formal employment protections remained out of reach for most workers. The sequence includes a modest endpoint improvement and a reversal after 2019.
Even regular employment can lack a written contract. The report puts regular workers without one at 59.6% in 2005, 69.8% in 2019 and 61.9% in 2022. Some of the later improvement reflected vulnerable regular jobs disappearing during the pandemic.1
This helps explain why employment and security can move differently. Work supplies income; protection affects what happens when that income is interrupted. A household’s ability to handle illness or a spell without work also depends on its savings, other earners, public provision and accessible family support. Where those buffers are weak, employment can sustain daily life while leaving little room for a setback.
Better pay and stronger protection can improve the same household through different routes. More earnings can increase the surplus available for saving. Reliable support during interruptions can reduce the resources the household must supply on its own. These are mechanisms to examine alongside job creation, rather than assume away once a person is counted as employed.
The peers did not take the same route
A comparison with other developing economies helps test whether India’s experience is simply what development looks like everywhere.
Consider the share of employment in agriculture:
| Country | 1991 | 2024 |
|---|---|---|
| India | 63.1% | 42.4% |
| Indonesia | 47.7% | 28.0% |
| Bangladesh | 69.9% | 44.7% |
| Vietnam | 74.0% | 25.9% |
| China | 59.6% | 22.2% |
These are World Bank/ILO modelled estimates from one data vintage, with the same indicator and comparison years. Survey definitions and model revisions affect precise levels.6
India’s movement out of agriculture was substantial. China and Vietnam made larger transitions on this measure, while Bangladesh retained a higher agricultural employment share than India. The comparison reveals room for different development paths, rather than one timetable every economy follows.
Sectoral change matters because an economy’s range of activities shapes the work people can enter. Our inference is that broader access to productive non-farm work is one candidate route through which development can reach more households. The quality of that transition matters: construction, industry and services each contain widely different earnings and protections. A sector label cannot establish a good job or identify the policy that produced it.
The relevant comparison is therefore twofold: how widely did new work become available, and how well did it support a livelihood? India’s transition and its peers’ larger shifts make that a useful research and policy question. The table supplies a contrast to explain, rather than a ready-made policy ranking.
Family resources change what a setback costs
Consider two people offered the same uncertain job. One has accessible savings or relatives able and willing to cover several months of expenses. The other must earn immediately to meet the same bills. Under those assumptions, the first can finance a longer search or withstand an interruption without cutting consumption as quickly. The second has less room to wait.
This is a conditional illustration of how resources can affect opportunity. Its usefulness does not depend on claiming that all families provide support or that all assets can pay the bills.
India’s wealth distribution makes the question consequential. Bharti, Chancel, Piketty and Somanchi estimate that in 2022–23, the top 1% of adults in the income distribution received 22.6% of pre-tax national income; the top 1% in the wealth distribution owned 40.1% of net wealth. These are adults aged 20 and above, and the two top groups need not be the same people. Their reconstruction combines national accounts, tax information, household surveys and rich lists; treatment of the richest tail affects the estimates.7
Unequal ownership motivates asking who has a usable buffer. The mechanism depends on liquidity, access within the family, debt and competing obligations. A valuable but inaccessible asset may provide little immediate help. The national shares do not measure those buffers or establish how inheritance’s effect changed across generations.
The reasonable inference is narrower and useful: the same earnings uncertainty can have different consequences when accessible starting resources differ. Education and effort operate within those circumstances. A precarious own-account worker and a wealthy asset owner consequently occupy very different positions, even though both might be described as working for themselves.
Concentration also has a history. The reconstructed top income share fell to 6.1% by 1982 before rising sharply.7 Distribution changed alongside development; its present shape was not an unbroken trend from independence.
Rich countries show why distribution and entry costs matter
Richer economies let us examine what can happen after average incomes have risen much further.
Chetty and colleagues estimate that about 90% of US children born in 1940 earned more than their parents, compared with about 50% of those born in the 1980s. Their baseline compares inflation-adjusted pre-tax household income near age 30. Earlier parental distributions are reconstructed, with sensitivity checks.8
The study also asks what would happen under different growth and distribution assumptions. Its broadly shared growth simulation closes 71% of the mobility gap, compared with 29% under its higher-growth scenario.8 These are conditional counterfactuals rather than measured policy effects. They nevertheless develop an important insight: how additional income is distributed can matter greatly to how widely a generation advances.
English housing shows both an entry burden and the possibility of improvement. In 2025, the median home sold for £300,000, about 7.6 times median gross annual earnings for a full-time employee. After 2021, median house prices rose 5% while earnings rose 25%, improving affordability, although it remained worse than early in the ONS series.9
The general lesson is conditional and practical: earnings growing faster than entry prices can make an expensive asset more attainable on that measure. Mortgage rates, deposits, rents and multiple earners also shape household experience.
For India, these studies suggest what to examine: the distribution of growth, the relationship between earnings and essential costs, and the resources available at entry into adulthood. Their US cohort percentages and English price ratios remain specific to those settings.
Participation and consumption are part of the progress
Recent improvements also belong in the explanation of changing opportunity.
Official PLFS figures show female labour-force participation rising from 37.0% in 2022–23 to 41.7% in 2023–24, with the female worker-population ratio rising from 35.9% to 40.3%. These national usual-status measures cover women aged 15 and above.10 More women were recorded as working or participating in the labour force. Whether that work supplied independent income, better choices or adequate protection requires looking at the jobs themselves.
HCES reports falling consumption inequality between those survey years: the rural Gini coefficient fell from 0.266 to 0.237 and the urban coefficient from 0.314 to 0.284.11 Alongside lower severe poverty and improved casual earnings, this shows why an account of household progress must include consumption as well as wages and assets.
These changes can coexist with concentrated ownership because they describe different things. Consumption concerns what people use; income what they receive; net wealth what they own after debt. Less unequal consumption does not require equally distributed ownership. A household can experience improved daily living while still having a thin buffer against lost earnings.
This distinction gives progress a substantive role in the argument. Development can ease deprivation and widen participation while the tasks of obtaining dependable work and accumulating reserves remain unfinished. Each improvement changes the starting point for the next task.
Where I’d Hold This Loosely
The strongest alternative explanation for some perceived decline is a combination of selective memory, changing expectations and changing household composition. Earlier secure-job beneficiaries may be overrepresented in family comparisons. That can explain a misleading baseline, but it does not erase measured earnings pressure or the persistence of informal work.
The larger missing piece is a like-for-like Indian household comparison across generations, including essential costs, debt, saving, protections and accessible family resources. The earnings-composition and wealth-measurement limits discussed above affect how far we can trace individual experiences or assign causes. They leave the observed gains and pressures in place.
The four-stage account is my synthesis of those findings. Evidence on vacancies, job-search duration, household buffers and matched-age outcomes would help determine which mechanisms matter most. It could strengthen this explanation or show that a different account fits better.
What the promise would have to deliver
The promise has several stages: acquire capabilities, find suitable work, receive dependable earnings and protection, then build resources for the future. India made substantial progress while leaving access uneven across those stages. That is a more informative account than judging the whole period as either success or decline.
If output keeps growing without improving household resources after essentials or strengthening protection, prosperity can rise alongside continued insecurity. If growth reaches more workers through better earnings, suitable jobs and effective support during setbacks, the pathway can become more reliable. These are conditional possibilities, not forecasts of which India will choose.
The useful test of development is how widely it enables people to turn better possibilities into lives they can sustain. Longer lives, more education and lower deprivation are achievements to build on. Dependable livelihoods are the next part of the same promise.
Footnotes
-
https://www.ilo.org/sites/default/files/2024-08/India%20Employment%20-%20web_8%20April.pdf ↩ ↩2 ↩3 ↩4 ↩5 ↩6 ↩7 ↩8
-
https://raw.githubusercontent.com/owid/owid-datasets/6155d4ca1ea14ef30e753010a25521eeb416e8a2/datasets/Maddison%20Project%20Database%202020%20%28Bolt%20and%20van%20Zanden%20%282020%29%29/Maddison%20Project%20Database%202020%20%28Bolt%20and%20van%20Zanden%20%282020%29%29.csv ↩
-
https://raw.githubusercontent.com/owid/owid-datasets/6155d4ca1ea14ef30e753010a25521eeb416e8a2/datasets/Life%20expectancy%20%28Gapminder%2C%20UN%2C%20IHME%29/Life%20expectancy%20%28Gapminder%2C%20UN%2C%20IHME%29.csv ↩
-
https://raw.githubusercontent.com/owid/owid-datasets/6155d4ca1ea14ef30e753010a25521eeb416e8a2/datasets/Educational%20Attainment%20-%20Barro%20Lee%20Education%20Dataset%20%282010%29%20/Educational%20Attainment%20-%20Barro%20Lee%20Education%20Dataset%20%282010%29%20.csv ↩
-
https://api.worldbank.org/v2/country/IND;IDN;BGD;VNM;CHN;GBR;USA;DEU;JPN;KOR/indicator/SI.POV.DDAY?format=json&per_page=20000 ↩
-
https://api.worldbank.org/v2/country/IND;IDN;BGD;VNM;CHN;GBR;USA;DEU;JPN;KOR/indicator/SL.AGR.EMPL.ZS?format=json&per_page=20000 ↩
-
https://wid.world/document/income-and-wealth-inequality-in-india-1922-2023-the-rise-of-the-billionaire-raj-world-inequality-lab-working-paper-2024-09/ ↩ ↩2
-
https://opportunityinsights.org/wp-content/uploads/2018/03/abs_mobility_paper.pdf ↩ ↩2
-
https://www.ons.gov.uk/peoplepopulationandcommunity/housing/bulletins/housingaffordabilityinenglandandwales/2025 ↩
-
https://www.mospi.gov.in/sites/default/files/press_release/Press_note_AR_PLFS_2023_24_22092024.pdf ↩
-
https://www.mospi.gov.in/sites/default/files/publication_reports/HCES%20FactSheet%202023-24.pdf ↩