TL;DR
India did not uniformly regress under the BJP. Real income per person rose, basic services expanded, poverty fell, and several health measures improved. But India largely maintained rather than decisively accelerated its earlier growth rate, while manufacturing, trade integration, productive employment, and reading outcomes fell short of what a developing country with India’s advantages could reasonably have achieved. Wealth concentration deepened and democratic checks weakened. The states make the causal story more complicated: BJP and non-BJP states appear among both the improvers and the laggards because inherited human capital, economic structure, fiscal capacity, administrative competence, and long-running political regimes filter what Delhi attempts. The most defensible verdict is delivery at scale without comparable transformation.
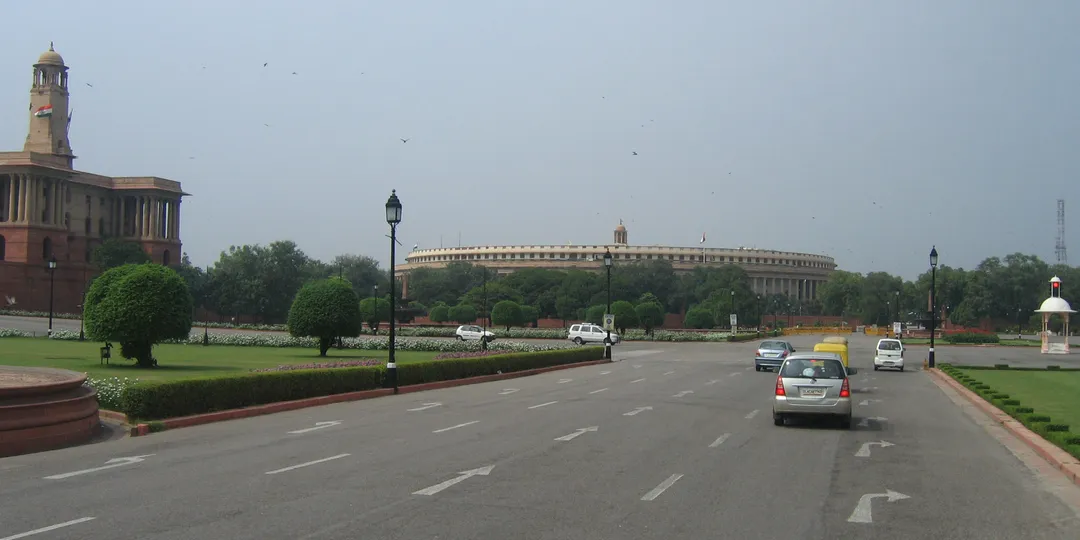
The road to Parliament crosses several layers of government before policy becomes an outcome. Photo: Vinayaraj, CC BY-SA 3.0, via Wikimedia Commons.1
India’s economy was larger in 2024 than in 2014. More homes had electricity and toilets. More adults had bank accounts. Infant and maternal mortality fell. Those statements are true.
They are also an incomplete way to judge a developing country.
If population rises, total production can rise while the average person gains little. If technology becomes cheaper, an unchanged government can deliver more phones, power connections, vaccines, and digital payments than its predecessor. If poorer countries normally catch up by importing knowledge and moving workers into more productive jobs, merely continuing to grow is not automatically an exceptional performance.
This creates a difficult but necessary distinction: an outcome can improve in absolute terms and still represent relative underperformance. The reverse is possible too. A government can improve a result more slowly than voters hoped while still outperforming comparable countries hit by the same shock.
So the question is not whether India became richer after Narendra Modi took office. It plainly did. The useful question is whether India improved faster than three relevant baselines: its population, its own earlier trajectory, and comparable developing economies. Then comes a second question that national scorecards usually evade: which level of government actually controlled the result?
A Country That Is Catching Up Is Supposed to Move
Imagine judging a person walking on an airport travelator. Their distance from the starting point tells you something, but not how much of the movement came from walking. To estimate their contribution, you need to know the speed of the belt.
Development has several such belts. Population growth expands domestic demand and aggregate labour. Technologies invented elsewhere become cheaper. Roads, schools, electrification, and public-health investments made decades earlier keep producing returns. Urbanisation and the movement of labour out of subsistence agriculture can raise productivity even without a policy breakthrough.
This does not mean growth happens automatically. States can waste these advantages, and shocks can reverse them. It means the fair test has layers:
- Did the outcome improve at all?
- Did it improve per person, per worker, or as a share of the relevant population?
- Did it improve faster than India’s own preceding trend?
- Did it outperform countries facing similar global conditions?
- Can the difference plausibly be connected to a policy under the government’s control?
The method changes near a ceiling. Raising electricity access from 85 percent to nearly universal coverage is harder than moving from 40 to 55 percent, because the final households are usually the most remote or difficult to serve. There, percentage points of the remaining gap closed are more informative than a simple growth rate.
This is why “nothing changed” can be a negative result in school learning or manufacturing: India had accumulated more income, infrastructure, technology, and administrative experience from which improvement should have followed. But neutrality is not proof of government damage. It becomes evidence of relative failure only after accounting for starting points, ceilings, measurement changes, and shocks such as COVID-19.
Growth Continued, but the Economy Did Not Transform Enough
Real GDP per person supplies the first correction to political claims built from the size of the economy. World Bank data show India’s real GDP per capita growing at roughly 5.2 percent a year from 2004 to 2014, 5.5 percent from 2014 to 2019, and 4.8 percent from 2014 to 2024.2 The full BJP-era figure includes the pandemic collapse, so it cannot be read as a clean policy comparison. The pre-pandemic figure matters precisely because it cuts against a simple regression story: per-person growth did not slow before COVID-19.
Nor does it establish an economic revolution. Over 2014–24, Bangladesh and Vietnam grew faster per person, while Indonesia grew more slowly.2 India remained a strong performer without clearly breaking away from either its own earlier rate or every relevant peer.
The composition of that growth is less flattering. Manufacturing value added fell from about 15.1 percent of GDP in 2014 to 13.1 percent in 2024.3 Trade fell from about 48.9 percent of GDP to 45.9 percent, and was lower still immediately before the pandemic.4 The World Bank’s assessment is that India’s participation in global value chains declined even as the economy grew, while rising tariffs and non-tariff barriers weakened the competitiveness of export-oriented firms.5
That distinction is the heart of the record. India generated more output, built infrastructure, and developed formidable digital systems. It did not move workers and capital into globally competitive, labour-absorbing production at the pace achieved by the strongest Asian comparators.
Calling this “collapse” would be false. Calling it structural transformation would be generous.
The Delivery Gains Are Real—even When the Attribution Is Shared
A relative audit should not become a technique for explaining away every success.
Electricity access rose from approximately 85 percent in 2014 to virtually universal access by 2024.6 Access to at least basic sanitation rose from about 54 percent to 83 percent.7 The sanitation trend began well before 2014, but maintaining a similar absolute pace while approaching the harder end of coverage is meaningful.
Financial inclusion expanded even more sharply. The share of adults with an account rose from 35 percent in 2011 to 53 percent in 2014, 80 percent in 2017, and 89 percent in 2024.8 That sequence also demonstrates why attribution must be shared. The expansion combined pre-2014 Aadhaar and banking infrastructure, the Jan Dhan programme, mobile connectivity, payment systems, and state-level delivery. A later government deserves credit for using and extending inherited architecture; inheriting part of the architecture does not make the subsequent scale imaginary.
Health and poverty moved in the right direction too. Infant mortality fell from 38.2 deaths per 1,000 live births in 2014 to 23.3 in 2024.9 India’s maternal mortality ratio fell from 130 in 2014–16 to 88 in 2020–22.10 The national multidimensional-poverty estimate fell from 24.85 percent in 2015–16 to 14.96 percent in 2019–21.11
Monetary-poverty claims need more caution. The World Bank estimates a very large decline between 2011–12 and 2022–23, but its own technical note explains that changes in survey design prevent a direct comparison without harmonisation choices.12 The broad direction is convincing. The exact magnitude—and the fraction attributable to one government—is less secure.
These gains matter because governance is not only economic transformation. Preventing a child’s death, connecting a remote home, or giving a woman direct access to a bank account is a substantive improvement even if it does not raise manufacturing’s share of GDP.
The problem is that access is not the same as capability. A bank account can remain inactive. A school can enrol a child who cannot read. A household can have an electricity connection without reliable, affordable power. Delivery opened doors; transformation required more people to walk through them into healthier, better-educated, more productive lives.
Employment Improved in Quantity More Than in Quality
India’s labour-market indicators improved after 2019, but the location and form of the new work complicate the celebration. The ILO and Institute for Human Development found that much of the increase came through self-employment and unpaid family work, with agriculture absorbing workers again after years of gradual movement away from it. Educated young people continued to face unusually high unemployment and a large mismatch between qualifications and available work.13
This is not “jobless growth” in the literal sense. More people reported working. It is a failure of productive transformation: too much of the adjustment occurred in low-productivity or insecure work rather than a mass movement into stable industrial and modern-service employment.
The distinction is particularly important for women. A rise in female labour-force participation is welcome, but work recorded as assistance in a household enterprise is not equivalent to an independent wage, bargaining power, or a durable career. Counting both as employment is statistically correct and socially incomplete.
The school system tells a parallel story. In rural India, the share of Standard III children able to read a Standard II text was 23.6 percent in 2014, 27.3 percent in 2018, 20.5 percent in 2022, and 27.1 percent in 2024. Standard V reading moved from 48.0 percent in 2014 to 48.8 percent in 2024. Arithmetic improved more clearly, and the recovery between 2022 and 2024 was substantial.14
Reading that is almost flat across a decade represents relative underperformance for a country that became richer and more connected. Yet the pandemic is an enormous confounder, and the recent recovery prevents the harsher claim that the system simply deteriorated continuously. Uttar Pradesh’s government schools, for example, recorded an especially large post-pandemic improvement in early-grade reading.14
This is what a serious relative assessment looks like: hold the decade-long stagnation and the recent achievement in view at the same time.
Inequality Rose, but Democratic Decline Is the Clearer Attribution
India’s distributional record became more unequal. World Inequality Lab estimates put the top one percent’s shares at 22.6 percent of income and 40.1 percent of wealth in 2022–23, with wealth concentration rising particularly sharply during 2014–23.15
The timing matters, but so does the longer history. India’s inequality began rising in the 1980s and accelerated after liberalisation. The BJP did not invent that trajectory. Its record is better described as failing to arrest—and in important respects enabling—an older concentration of gains. That is still politically meaningful, but it is not the same causal claim.
The deterioration of democratic correction mechanisms is harder to detach from the Union government. V-Dem classifies India as an electoral autocracy and traces the decline through freedom of expression, media independence, civil society, and constraints on executive power.16 Any single democracy index contains contestable judgements. The exact label should therefore carry less weight than the documented direction across several institutional dimensions.
This domain also differs from infant mortality or school learning. Delhi does not directly teach every child or staff every primary-health centre. It does exercise much more direct control over central investigative institutions, national legislation, appointments, parliamentary procedure, and the political environment in which media and civil society operate.
Democratic safeguards are not a decorative extra to a development record. They are the mechanisms by which a system detects mistakes, exposes capture, replaces bad information, and forces correction. A government can deliver efficiently while weakening the instruments that reveal where delivery has failed. That combination may look strong in the short run and become brittle over time.
India Does Not Have One Government
A national result is produced by several administrations stacked on top of one another.
The Union government has the strongest control over macroeconomic management, tariffs, national taxation, interstate transfers, central regulation, national institutions, and the design of major schemes. States dominate day-to-day schooling, health delivery, policing, land administration, electricity distribution, local roads, and much welfare implementation. Several important systems—GST, infrastructure, health missions, employment schemes, and education programmes—are shared.
This makes ordinary political attribution unreliable. A centrally funded scheme can succeed because a capable state implements it well. A state programme can depend on Union tax transfers. A national average can rise because already capable states advanced while lagging states barely moved.
The fiscal division is large enough to change the analysis: states account for roughly 60 percent of Indian general-government expenditure and undertake most public capital expenditure.17 Treating every outcome after 2014 as the prime minister’s report card is not merely unfair. It misdescribes how the Indian state works.
The State Results Break the Party Scoreboard
The Economic Advisory Council to the Prime Minister has reconstructed states’ per-capita income relative to the national average over more than six decades. A value of 100 means a state’s per-capita income equals India’s average. The following selected changes are from 2010–11 to 2023–24, except Gujarat’s latest figure, which is for 2022–23.18
| State | 2010–11 | Latest | Direction |
|---|---|---|---|
| Karnataka | 115.2 | 180.7 | Strong relative gain |
| Tamil Nadu | 145.3 | 171.1 | Strong high-base gain |
| Gujarat | 143.4 | 160.7 | High-base gain |
| Madhya Pradesh | 60.1 | 77.4 | Low-base gain |
| Assam | 61.2 | 73.7 | Low-base gain |
| Uttar Pradesh | 49.4 | 50.8 | Almost flat relative position |
| West Bengal | 87.5 | 83.7 | Relative decline |
| Bihar | 35.4 | 32.8 | Relative decline from a low base |
This is not a clean natural experiment. The period begins before the BJP formed the Union government; states changed governments; and the measure excludes remittances, which particularly affects states such as Kerala and Bihar. It is nevertheless fatal to a simple party theory.
Long-running BJP or NDA states include Gujarat, Madhya Pradesh, Assam, Uttar Pradesh, and Bihar. Their relative trajectories range from strong improvement to near-stagnation and decline. States governed by regional parties or alternating coalitions include Tamil Nadu, Karnataka, Telangana, Odisha, West Bengal, and Punjab. Their records also range from exceptional gains to relative deterioration.
Gujarat’s take-off began before the national BJP era. Tamil Nadu’s broad social and industrial model survived repeated changes of government. Karnataka and Telangana benefited from powerful urban and technology clusters. Odisha improved from a low base under a regional government. Uttar Pradesh combined a persistently low relative income with recent gains in some service-delivery indicators. None of these histories fits comfortably inside “double engine” or “non-BJP model.”
Party leadership still matters. Governments choose priorities, recruit officials, maintain coalitions, and decide whether to preserve or dismantle useful programmes. But party label is not the master variable.
What Actually Separates the States
The state evidence points toward a layered explanation.
First, inherited human capital. States that built broad schooling, nutrition, and public health earlier entered the liberalisation era with workers and citizens better able to use new opportunities. These gains compound over generations.
Second, economic structure and geography. Ports, large cities, industrial supplier networks, agricultural conditions, and proximity to markets shape which investments are plausible. Policy can amplify these advantages or squander them, but it does not create every starting condition.
Third, fiscal capacity and spending quality. The IMF finds that richer states continued to grow faster over 2002–23 rather than converging with poorer ones. Low-income states often combine heavier debt constraints with weaker investment in health, education, and productive infrastructure, producing a feedback loop in which weak capacity repels the private investment needed to expand the tax base.17
Fourth, administrative capacity. Research comparing Indian states finds that prior measures of state capacity and accountability predict later performance in programmes such as rural roads and employment guarantees—completion, delays, construction quality, and contractor concentration—not merely how much money was announced.19
Fifth, durable political regimes. Tamil Nadu’s welfare-and-industrial settlement, Gujarat’s growth orientation, Kerala’s human-development system, and the historically weaker capacity of Uttar Pradesh and Bihar have persisted across individual chief ministers. Elections alter these regimes, but usually more slowly than campaign narratives imply.20
Union alignment can affect coordination and the flow of resources. Evidence also suggests that politically aligned states may receive more favourable fiscal transfers.21 But research has not established a general growth premium from having the same party in Delhi and the state capital. “Double engine” is therefore a plausible coordination mechanism, not a demonstrated law of development.
Where This Verdict Should Be Held Loosely
Three limits prevent the argument from becoming another partisan scoreboard.
First, 2014 is a political breakpoint, not an experimental one. India in 2014 inherited roads, institutions, demographics, liabilities, private firms, and policy architecture from earlier governments. Later outcomes mix inheritance with new decisions.
Second, the pandemic cuts through almost every series. Including it understates pre-pandemic growth and exaggerates the government’s responsibility for learning loss; excluding it would erase an important test of state capacity and the quality of the recovery.
Third, data revisions and survey breaks matter. Poverty estimates, labour-force measures, state income, and democracy indices do not all possess the same precision. A decimal point is not evidence of causal certainty.
These cautions weaken extravagant claims on both sides. They do not make evaluation impossible. They tell us to match confidence to control: assign the Union more responsibility for trade policy and democratic institutions, states more for classroom and clinic execution, and shared credit or blame where programmes and money cross federal layers.
Delivery Without Transformation
The BJP-era national record contains several truths that political debate tries to separate.
India delivered basic access at extraordinary scale. It reduced deprivation, improved mortality, expanded financial infrastructure, and remained one of the world’s faster-growing large economies. A verdict that cannot acknowledge those gains is advocacy, not assessment.
India also failed to convert enough of that scale into productive jobs, export competitiveness, manufacturing depth, or broad learning. It became more unequal and less institutionally open to correction. A verdict that treats aggregate GDP and visible infrastructure as a complete report card is equally unserious.
The states explain how both can be true. Delhi can build platforms, move money, set national rules, and alter the political climate. Whether a child learns, a clinic functions, a road survives the monsoon, or an investor finds skilled labour depends heavily on capabilities accumulated inside the states over decades.
So the honest verdict is neither national decline nor national transformation. It is delivery without enough transformation, filtered through a federation of radically unequal state capacity.
That conclusion is less emotionally satisfying than a party score. It is also more useful. It identifies where progress was real, where the baseline did part of the work, where opportunity was missed, and where political responsibility actually belongs.
Footnotes
-
https://commons.wikimedia.org/wiki/File:Paliament_of_India_-_Delhi.jpg ↩
-
https://data.worldbank.org/indicator/NY.GDP.PCAP.KD?locations=IN-BD-VN-ID ↩ ↩2
-
https://data.worldbank.org/indicator/NV.IND.MANF.ZS?locations=IN ↩
-
https://data.worldbank.org/indicator/NE.TRD.GNFS.ZS?locations=IN ↩
-
https://thedocs.worldbank.org/en/doc/18e328e242c0a01bfcb5693e425bb0d8-0310012024/original/WB-IDU-September-2024.pdf ↩
-
https://data.worldbank.org/indicator/EG.ELC.ACCS.ZS?locations=IN ↩
-
https://data.worldbank.org/indicator/SH.STA.BASS.ZS?locations=IN ↩
-
https://data.worldbank.org/indicator/FX.OWN.TOTL.ZS?locations=IN ↩
-
https://data.worldbank.org/indicator/SP.DYN.IMRT.IN?locations=IN ↩
-
https://nhm.gov.in/index1.php?lang=1&level=2&lid=218&sublinkid=822 ↩
-
https://www.undp.org/india/publications/national-multidimensional-poverty-index-progress-review-2023 ↩
-
https://documents1.worldbank.org/curated/en/099060325033540333/pdf/P180633-e1a59178-dc78-4b14-8928-1c88d02240f3.pdf ↩
-
https://www.ilo.org/sites/default/files/2024-08/India%20Employment%20-%20web_8%20April.pdf ↩
-
https://asercentre.org/wp-content/uploads/2022/12/ASER_2024_Final-Report_13_2_24-1.pdf ↩ ↩2
-
https://wid.world/wp-content/uploads/2024/03/WorldInequalityLab_WP2024_09_Income-and-Wealth-Inequality-in-India-1922-2023_Final.pdf ↩
-
https://www.v-dem.net/documents/75/V-Dem_Institute_Democracy_Report_2026_lowres.pdf ↩
-
https://www.imf.org/-/media/files/publications/wp/2024/english/wpiea2024235-print-pdf.pdf ↩ ↩2
-
https://eacpm.gov.in/wp-content/uploads/2024/09/State-GDP-Working-Paper_Final_240916_190207.pdf ↩
-
https://giace.org/wp-content/uploads/2021/09/11.2_Published_Measuring-Performance-Ranking-State-Success-Over-Two-Decades-in-India-1.pdf ↩